During debugging, hovering over a variable shows the value it currently holds. In Version 2010, this is called data tip. Hovering over a variable during debugging gives an option of "pinning" the variable and its value to the source file. Then, as you trace the program this data tip will always show the value of the specified variable.
 By default the editor windows in
MSVS are fixed on tabled planes of MSVS. This fixed position is
called docking. A window can be moved, or floated
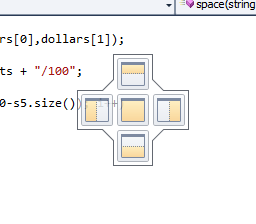
anywhere on the screen. You can float the docked window by dragging
the window's tab or title bar to the desired position. A guide
diamond is a tool (see picture) that can be used to re-dock the
floated window. It appears once the floated window is dragged by its
title bar towards the center of the MSVS. If you release the mouse
once it is in on of the arrow or the center of the guide diamond, the
dragged window is docked in the appropriate pane of MSVS.
By default the editor windows in
MSVS are fixed on tabled planes of MSVS. This fixed position is
called docking. A window can be moved, or floated
anywhere on the screen. You can float the docked window by dragging
the window's tab or title bar to the desired position. A guide
diamond is a tool (see picture) that can be used to re-dock the
floated window. It appears once the floated window is dragged by its
title bar towards the center of the MSVS. If you release the mouse
once it is in on of the arrow or the center of the guide diamond, the
dragged window is docked in the appropriate pane of MSVS.
Double-clicking on the tab or the title bar of the docked window undocks it. Double clicking on the title bar of the undocked window maximizes it. Double clicking on the title bar of the maximized window returns it to its previous size. Double clicking on the title bar of the floated window returns it back to its previous docked location.
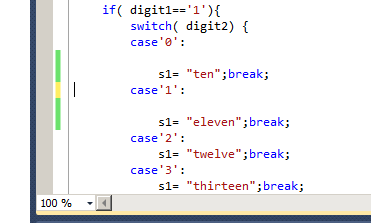 By default, MSVS tracks saving of
changes in the source file. The green bar on the left of a particular
line indicates that this line was saved. The yellow bar indicates that
the line was modified since last time the file was saved.
By default, MSVS tracks saving of
changes in the source file. The green bar on the left of a particular
line indicates that this line was saved. The yellow bar indicates that
the line was modified since last time the file was saved.
This behavior may be turned on and off by going to Tools -> Options -> Text Editor -> Track Changes .
The number of indentation spaces can be modified by going to Tools -> Options -> Text Editor -> C/C++ -> Tabs -> Indent size
Foldable constructs are marked by plus or minus signs on the left border of the editor window. To fold construct click on the minus sign. To unfold a construct --- click on the plus sign.
Ctrl+M Ctrl+M folds or unfolds the current code block. Ctrl+M Ctrl+O folds all code blocks. Ctrl+M Ctrl+L unfolds all code blocks.
Itellisense can be used for word completion. Once you typed enough to unambiguously complete the variable, function or anther construct name, you can press Alt-RIGHT ARROW for MSVS to complete the name. If the beginning is ambiguous MSVS opens the dropdown box with the completion variants.
 For class member functions
(methods) MSVS can show the picture of method invocation
called Call Hierarchy. Specifically, in the Call
Hierarchy window, for each particular method MSVS shows which
methods invoke (call) this method and which methods are called from
this method. The information is recursive: each method in the
caller/callee list can be further expanded. Note that the list of
methods is available only after the method is defined. Call
Sites pane shows the particular lines where the method is
invoked. If you right-click on the function and select Go To
Definition or press F12, MSVS shows the method
definition in the Editor window.
For class member functions
(methods) MSVS can show the picture of method invocation
called Call Hierarchy. Specifically, in the Call
Hierarchy window, for each particular method MSVS shows which
methods invoke (call) this method and which methods are called from
this method. The information is recursive: each method in the
caller/callee list can be further expanded. Note that the list of
methods is available only after the method is defined. Call
Sites pane shows the particular lines where the method is
invoked. If you right-click on the function and select Go To
Definition or press F12, MSVS shows the method
definition in the Editor window.
To show call hierarchy for the particular method, right-click on its name in the editor window and select View Call Hierarchy or press Ctrl+K, Ctrl+T
As you move the cursor in the editor, Code Definition Window shows the function prototypes, type definition, etc. available in the particular scope. Object Definition Window displays the available scopes.