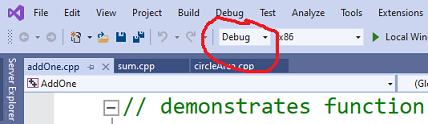
 Debug mode executable is larger in size and slower, but otherwise
performs similarly to release mode executable. You can easily switch
between compilation modes through the window in the top toolbar.
Debug mode executable is larger in size and slower, but otherwise
performs similarly to release mode executable. You can easily switch
between compilation modes through the window in the top toolbar.
Debug mode executable is larger in size and slower, but otherwise
performs similarly to release mode executable. You can easily switch
between compilation modes through the window in the top toolbar.
Alternatively, pressing F10 would start the program and suspend it on the first executable line.
Hitting "step over" F10 key or clicking on the appropriate icon on the toolbar, advances the program execution exactly one line. Repeatedly "stepping over" the lines of the program in this fashion allows the programmer to trace the program execution in detail.
"Autos" shows only the variables three lines above and three lines below the current statement. The amount of information shown is limited and it allows you to focus on the variables that are relevant to the context. This is particularly helpful if the program is large, the number of in-scope variables is big and the "Locals" tab becomes crowded.
 The values of the local variables are displayed by the MSVS
automatically in the "Autos" and "Locals" tab of the debugging
window. However, some values cannot be automatically shown. For
example, once an array is passed to a function as a parameter, its size
information is lost. The debugger cannot present the array and its
contents properly.
The values of the local variables are displayed by the MSVS
automatically in the "Autos" and "Locals" tab of the debugging
window. However, some values cannot be automatically shown. For
example, once an array is passed to a function as a parameter, its size
information is lost. The debugger cannot present the array and its
contents properly.
The debugger window has "Watch" tab to display arbitrary values. For example, you can instruct it to compute and display an expression based on the values of the variables. Watch can be used to display arrays once its size information is lost. For that, in the name column enter the name of the array, then "comma" then the array size you want to observe. Once entered, the watch can be expanded to observe all values of the array. See figure.
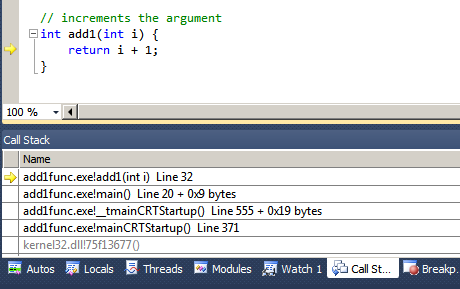 As you trace your program, it is possible to examine program stack
frames of all the caller functions with their respective local
variables. MSVS display program stack in "Call Stack" tab of the
bottom-right debug windows. The yellow arrow indicates the function
frame where the execution is currently suspended. By double-clicking
on the particular function frame in the stack, you can observe the
variables that are local to the selected frame the "Locals" tab of
this window.
As you trace your program, it is possible to examine program stack
frames of all the caller functions with their respective local
variables. MSVS display program stack in "Call Stack" tab of the
bottom-right debug windows. The yellow arrow indicates the function
frame where the execution is currently suspended. By double-clicking
on the particular function frame in the stack, you can observe the
variables that are local to the selected frame the "Locals" tab of
this window.