Visual Studio Code Debugging
Setting up VS Code
Instructions for setting up Visual Studio Code to compile C++ are available [here](vscodelocal.html). Upon completing this tutorial, you should be able to run the debugger.
Debugging with VS Code
Set breakpoints
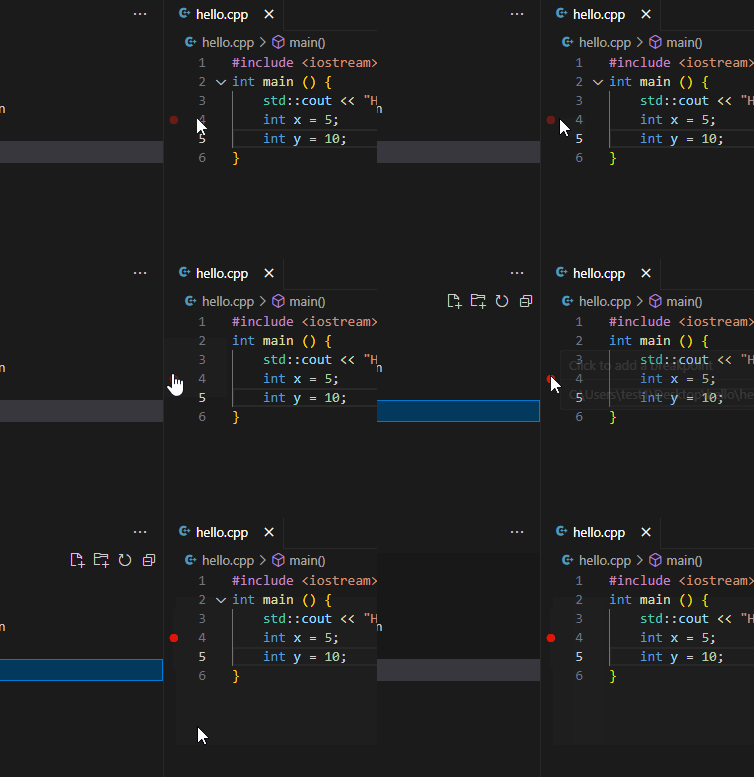
To determine how the debugger steps through your program, you can set breakpoints. In VS Code, breakpoints are set by clicking the space between the line numbers and the right pane. A red dot will appear on the line, and the debugger will stop execution before the line is ran.

Run the debugger
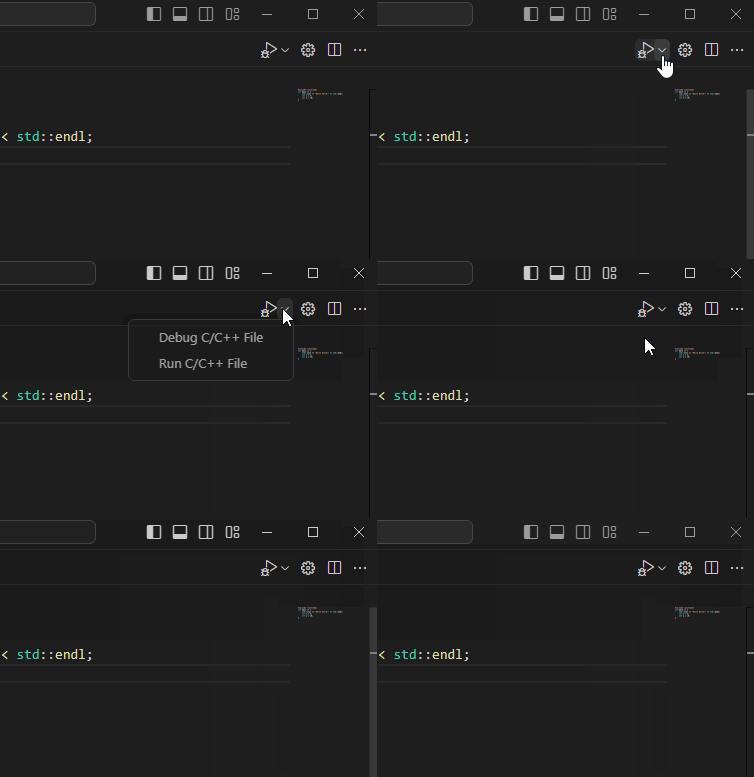
With breakpoints set, the debugger can be ran by clicking the dropdown next to the play button (the same one used to compile) and selecting debug from the options that appear.

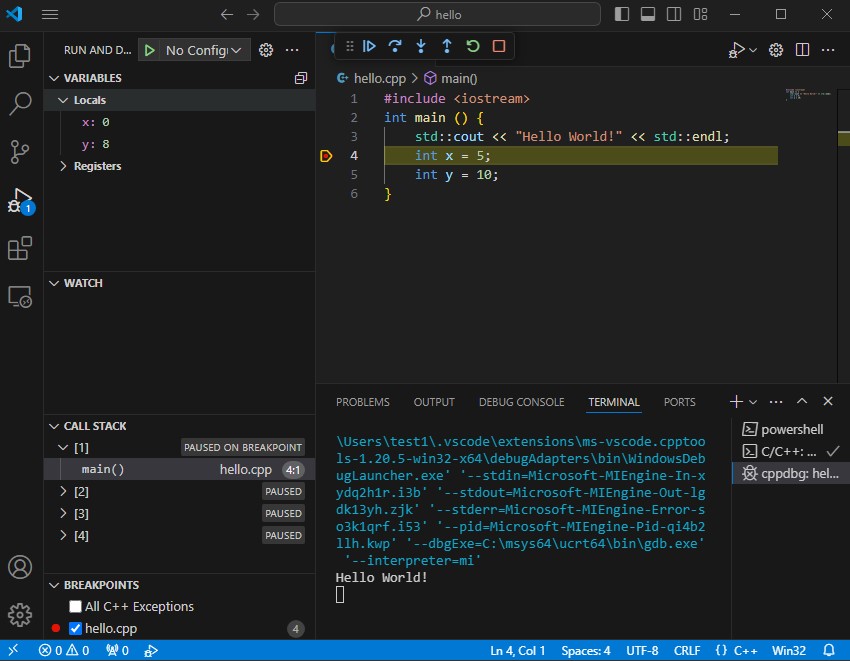
The debugger runs up to the first breakpoint, and you are presented with a screen similar to this:

- The right side of the window populates with four panes titled Variables, Watch, Call Stack, and Breakpoints.
- The variables pane allows you to see the value of variables within the scope of the current breakpoint.
- The Watch pane allows you to select variables and expressions to pay attention to as the program is executed. The values displayed in this pane also depend on the scope of the current breakpoint.
- The Call Stack pane shows you where the breakpoint is in the call stack.
- The Breakpoints pane allows you to select which breakpoints the debugger uses.
Step through your program
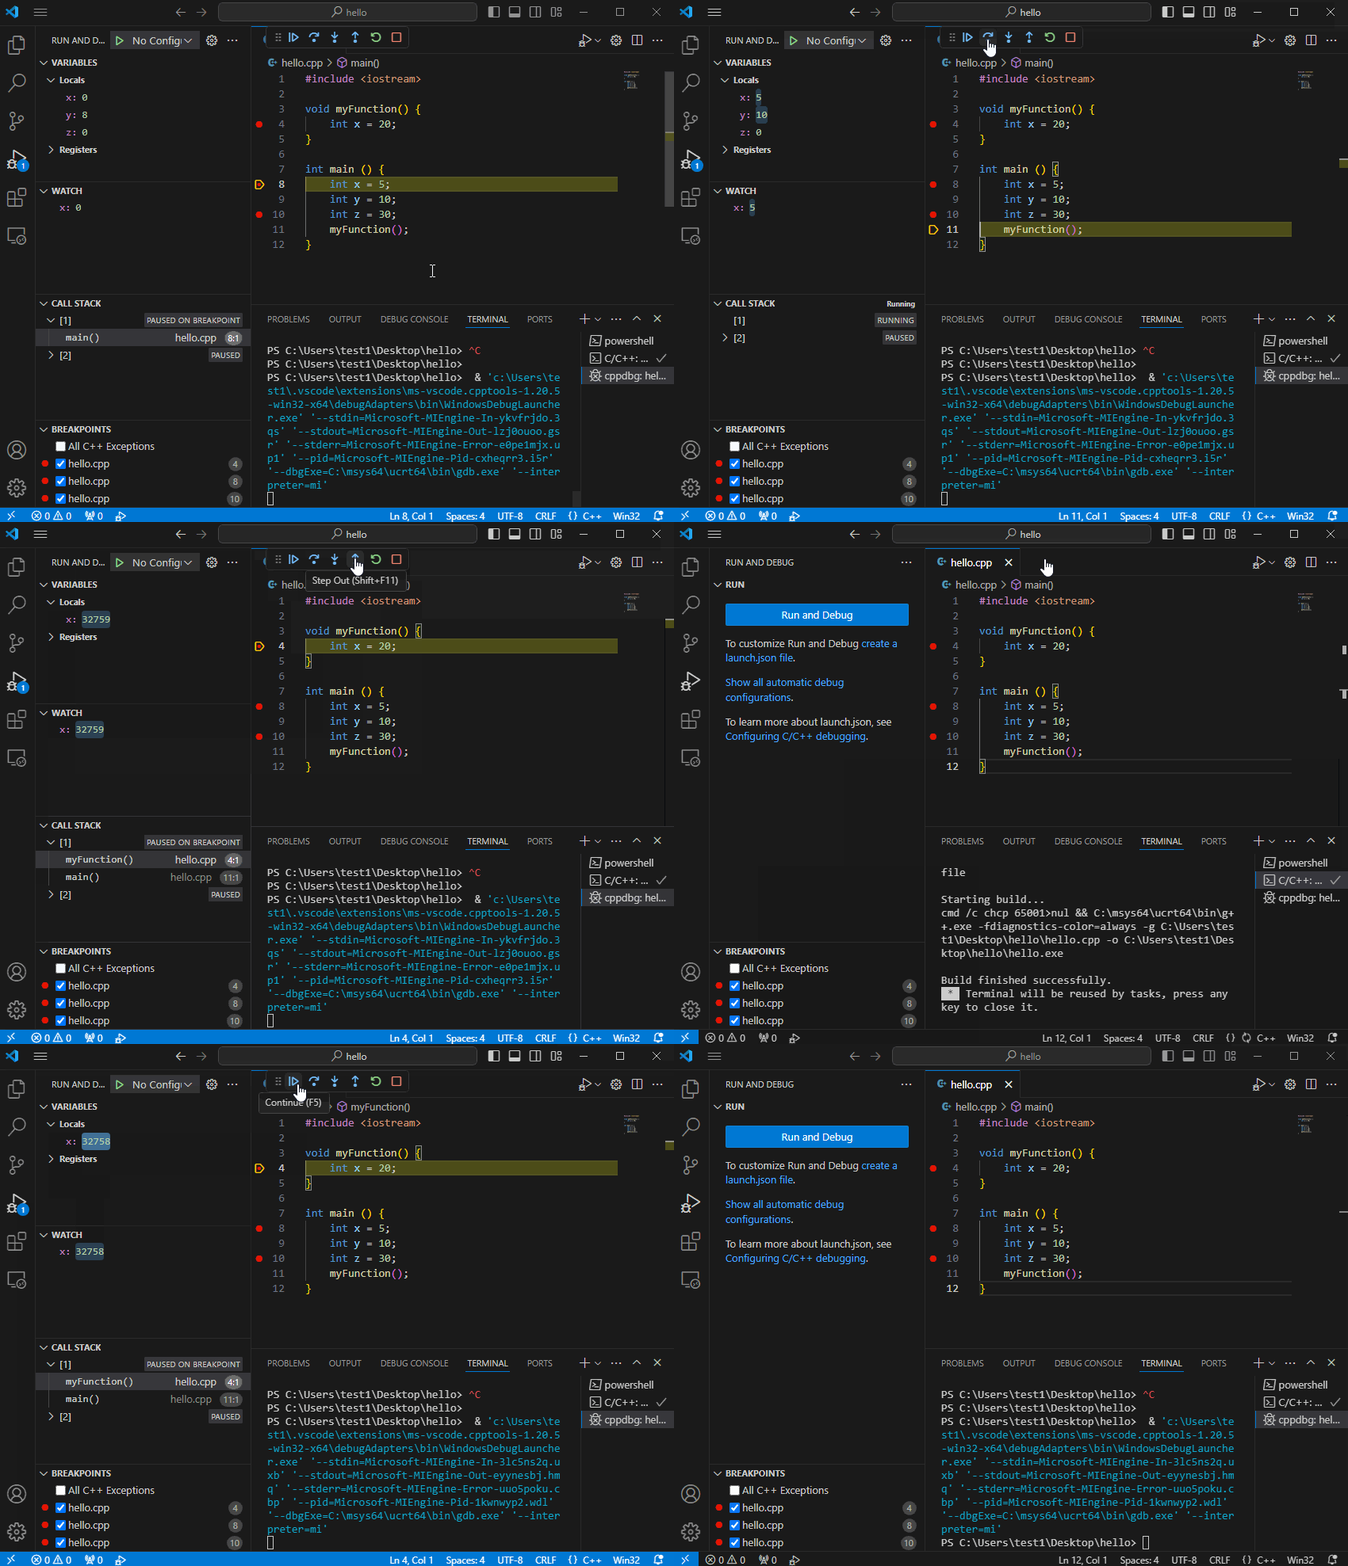
A series of buttons appear at the top of the window when the debugger is running. These buttons are used to control how the debugger steps through the program. The buttons function as follows (from left to right):
- The continue buttom progresses to the next breakpoint.
- The "step over" button runs the next line of the program. Clicking the button multiple itmes effectively runs the program line by line; allowing the state of variables and the call stack to be viewed after each instruction.
- The "Step Into" and "Step Out" allow traversal of the call stack.
- The restart and stop buttoms restart and stop the debugger.

Compiling and Debugging with Multiple Files
notes
- Ensure that the folder opened in VS Code contains only your project
- Note that all C++ files in the opened folder will be compiled
- Example configuration files can be found here
If your project has multiple files, you can configure the `tasks.json` file to compile all of the C++ files you currently have open. Do this by opening .vscode -> tasks.json and replacing `${file}` with `${workspaceFolder}/*.cpp` under the `args` entry.
With this configuration change made, go back to the file with the main part of your program and run the compiler. You should be able to step through functions included in other files when breakpoint are set accordingly.
Debugging in MacOS
MacOS does not support standard input when debugging using the VS Code console. In order to debug projects using MacOS, the XCode debugger can be used.
Using XCode
- Install XCode if not already instealled
- Create a new project, select "Command Line Tool" under "macOS"
- Name the project and select C++ as the language
- Save the project within your subversion repository
- Delete the template files and move anything you have already worked on into the project directory created by XCode
- Click the play button above the file browser when you are ready to build your project
- Breakpoints work similarly to VS Code and can be set/unset by clicking the margin between the line number and the file browser